發表文章

目前顯示的是有「Python」標籤的文章

[第23期]Use pytube and PySide to download YouTube audio(mp3)/使用pytube與PySide下載YouTube聲音檔(mp3)

圖片
This vedio shows how to use pytube and PySide to download YouTube audio (mp3). The content includes:  PySide Introduction Filter Audio Stream Download and rename Youtube mp3 file   本視頻說明如何使用pytube與PyQt下載YouTube影片。 內容包含:  PySide簡介 篩選聲音資料流 下載和重新命名YouTube MP3檔 Pyside template  import sys from PySide6 import QtWidgets from PySide6 . QtCore import QFile , QIODevice from PySide6 . QtUiTools import QUiLoader class MainWindow ( QtWidgets . QMainWindow ):     def __init__ ( self , ui_file_name , * args , ** kwargs ): # access methods of the base class         super ( MainWindow , self ). __init__ (* args , ** kwargs )         # Load the UI Page by PySide6         loader = QUiLoader ()         file = QFile ( ui_file_name )         file . open ( QIODevice .ReadOnly)         self . ui = loader . load ( file )     ...

[第19期]Write a PyQt calculator program by using MVC architecture/使用MVC架構寫一個PyQt計算機程式

圖片
  This video demonstrate how to write a PyQt calculator program by using MVC architecture. The content includes: 1. MVC Architecture Introduction 2. Place codes with different purposes into Model.py, View.py and Controller.py PS: calculator.py please refer to video No. 18. 本視頻說明如何使用MVC架構寫一個PyQt計算機程式, 內容包含: 1. MVC架構簡介 2. 將不同意義的程式碼分別寫在Model.py, View.py以及Controller.py中。 註: calculator.py請參考第18期視頻 PyQt Template模板 import sys from PyQ t5 import QtWidgets , uic class MainWindow ( QtWidgets . QMainWindow ): def __init__ ( self , * args , ** kwargs ): super ( MainWindow , self ). __init__ ( * args , ** kwargs ) #Load the UI Page by PyQt5 uic . loadUi ( "ui name.ui" , self ) self . setWindowTitle ( "ui title" ) def main (): app = QtWidgets . QApplication ( sys . argv ) main = MainWindow () main . show () sys . exit ( app . exec ()) if __name__ == '__main__' : m...

[第18期]Use PyQt and Qt Designer to implement GUI of Calculator/使用PyQt與Qt Designer製作計算機圖形介面

圖片
This video introduce how to use PyQt and Qt Designer to implement GUI of Calculator. Including: 1. Use Qt Designer to design User Interface  2. Load UI file  3. Connect “Signal”and “Slot”  Use Signal/Slot Editor in Qt Designer中 Use connect() Method to connect Signal and Slot 4. Make a calculator with Button, LineEdit and Label 本視頻介紹如何使用PyQt與Qt Designer製作計算機圖形介面,內容包含: 1. 使用Qt Designer設計介面  2. 在PyQt中載入UI檔  3. 連接"信號"與"槽"  在Qt Designer中使用Signal/Slot Editor 在程式中使用connect()方法連結Signal和Slot 4. 使用按鈕、文字輸入與標籤來製作計算機 (2022/10/13) Updated Video/更新的視頻 PyQt Template模板 import sys from PyQ t5 import QtWidgets , uic class MainWindow ( QtWidgets . QMainWindow ): def __init__ ( self , * args , ** kwargs ): super ( MainWindow , self ). __init__ ( * args , ** kwargs ) #Load the UI Page by PyQt5 uic . loadUi ( "ui name.ui" , self ) self . setWindowTitle ( "ui title" ) def main (): app = QtWidget...

[第12期]Migrate LabVIEW to Python: Use Expression Node and Math library/使用Expression Node和Math函式庫

圖片
This video shows how to use mathematical functions in LabVIEW and Python. We introduce Expression Node for non-conplex data type calculation in LabVIEW and applications of Math library in Python. Some examples (conversion of degree and radian, the plot of sine wave etc.) are provided for the demonstration of Expression Node and Math library in LabVIEW and Python respectively. 本視頻說明如何在LabVIEW和Python中使用數學函數。 我們介紹LabVIEW的Expression Node來處理簡單的資料型態,以及Math函數庫在Python中的應用。 我們也提供的一些範例,如角度與弧度間的轉換、Sine波的繪製,來說明Expression Node和Math函數庫分別在與Python中應用。 References: 1. Expression Node ( https://zone.ni.com/reference/en-XX/help/371361R-01/glang/expression_node/ ) 2. math数学函数 ( https://docs.python.org/zh-tw/3.7/library/math.html#angular-conversion )

[第11期]Migrate LabVIEW to Python: read file to XY graph/使用Python改寫LabVIEW程式: 讀檔輸出XY圖

圖片
This video shows how to migrate LabVIEW to Python. Examples of reading file to XY graph are demonstrated by using LabVIEW and Python. Content: 1. Read file and plot XY graph with LabVIEW 2. Read file and plot XY graph with Python 本視頻說明如何使用Python改寫LabVIEW程式,分別使用LabVIEW與Pyhon寫出讀檔輸出XY圖的範例來說明。 內容: 1. LabVIEW讀檔並繪製XY圖 2. Python讀檔並繪製XY圖

[第2期]使用LabVIEW Python Node與OpenCV來讀取圖片/Use LabVIEW Python Node and OpenCV to read image

圖片
本影片介紹如何使用LabVIEW Python Node與OpenCV來讀取圖片。 This video shows how to use LabVIEW Python Node and OpenCV to read image. 步驟 Steps: 1. 使用命令提示字元安裝OpenCV Install openCV in Comand Prompt 2. 完成OpenCV讀取圖片的函數 Complete ReadImage() function 3. 用Python Node呼叫讀圖的函數 Call function by Python Node

[Colab][Python]define function定義函數

圖片
  This video shows 5 kinds of examples for definition of function. 這個影片展示5種定義函數的範例。 1.Define function (no parameter)定義函數(無參數) 2.Define function (parameters)定義函數(參數) 3.Define function (parameters) with Return (single value) 定義函數(參數) 回傳值 4.Define function (parameters) with Return (multiple value) 定義函數(參數) 回傳多個值 5.Define function (*parameter: multiple parameters) with Return (single value) 定義函數(*參數: 多參數) 回傳值

[Python] Update and delete data with SQLite in Colab/在Colab中更新與刪除SQLite資料庫

圖片
  This example shows how to use python to comunicate with SQLite in Colab. 這個範例說明如何在Colab中使用python來與SQLite溝通。 7. Update data in table 更新資料表中的資料 8. Delete data in table 從資料表中刪除資料 Previous video: 先前影片 https://www.youtube.com/watch?v=mRuwI-ve5To

[Python][Colab][SQlite] Wite and read data with SQLite in Colab在Colab中讀寫SQLite資料庫

圖片
This example shows how to use python to comunicate with SQLite in Colab. 這個範例說明如何在Colab中使用python來與SQLite溝通。   1. Mount Google drive for Colab use 在Colab中掛載Google硬碟 2. Ceate database in Google drive 在Google硬碟建立資料庫 3. Create Table and add header 建立表單與加入表頭 4. Insert the single row data to table 加入單列資料到表單中 5. Read data from the table 從表單中讀取資料 6. Insert the muliti rows of data to table 加入多列資料到表單中

[Colab][python]Install and use yfinance in Colab/在Colab上安裝與使用yfinance函式庫

圖片
 This video shares how to install and use yfinance in Colab 本影片分享如何在Colab上安裝與使用yfinance函式庫 1. Install yfinance library 安裝yfinance函式庫 2. Get single item or all items from stock information 獲取單一或全部的股票資訊項目 3. Get historical data of stocks (5days) 獲取股票的歷史資料  (5天) 4.  Download  historical data as .csv from google to location 將google上的歷史資料下載到在地端存成.csv檔 5. Download  historical data with start, end time and interval 使用開始、結束時間與間隔來下載歷史資料

[Python][tkinter] Build tkinter GUI 使用tkinter建立圖形視窗

圖片
This example shows how to build a GUI by using tkinter. 1. Import tkinter 2. build a window named "win". 3. window format 1: title() 4. window format 2: geometry() determine size and initial position(x,y) 5. window format 3: maxsize() set max size of a window 6. Build Button component and give a string to text 7. Use pack to arrange Button on left side 8. Build Label component and give a string to text 9. Use pack to arrange Build Label on right side 10. use mainloop() to keep window running for monitoring and handling events 這個範例介紹如何使用tkinter建立圖形視窗。 #1. 引入tkinter #2. 建立一個名為win的新視窗 #3. 視窗格式: 標題 Title() #4. 視窗格式: 設定視窗啟動時的大小與位置 geometry("寬x長+x位移+y位移") #5. 視窗格式: 設定視窗最大尺寸 maxsize(int長,int寬) #6. 建立Button元件,按鍵文字 Text = "" #7. Button元件布局 pack(side='left') 靠左 #8. 建立Label元件,按鍵文字 Text = "" #9. Label元件布局 pack(side='right') 靠右 #10. mainloop()在使用者關閉...

在VS code中安裝Python套件virtualenv

圖片
在Python的開發中,通常會使用 VirtualEnv,將系統的Python環境複製一份到VirtualEnv建立的資料夾,以便管理執行環境,以及開發不同應用程式的套件管理。 安裝VirtualEnv 的指令如下: pip install virtualenv 在D槽建一個pydemo資料夾,並切換到該資料夾目錄 cd D:\pydemo 或是 cd D:\ mkdir pydemo cd pydemo 下指 令建立 虛擬環境的工程目錄   virtualenv --no-site-packages .venv PS D:\pydemo> virtualenv --no-site-packages .venv Using base prefix 'c:\\users\\xxxxx\\anaconda3'   No LICENSE.txt / LICENSE found in source New python executable in D:\pydemo\.venv\Scripts\python.exe Installing setuptools, pip, wheel... done. 將目前power shell的環境切換到虛擬環境之中 PS D:\pydemo> . ./.venv/Scripts/activate.ps1 (.venv) PS D:\pydemo> .venv資料夾的內容 參考文件: 1.  在 Visual Studio Code 中配置 Python Flask 环境   ( https://segmentfault.com/a/1190000012149680 ) 2.  Python with VirtualEnv ( https://dotblogs.com.tw/mystic_pieces/2018/11/01/232938 ) 3.  Git 教學:終端機及常用指令介紹 ( https://gitbook.tw/chapters/command-line/command-line.html )

在VS code IDE中查詢Python安裝的套件

圖片
在VS code IDE中查詢Python安裝的套件,在Terminal中輸入 pip list 即會出現已安裝的套件清單

使用VS code開發Python程式 - Matplotlib繪圖

圖片
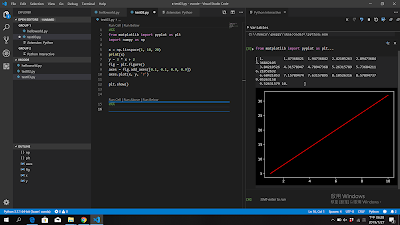
這一篇為如何在VS code的IDE 中用python開發matplotlib, 程式碼如下: #%% from matplotlib import pyplot as plt import numpy as np x = np.linspace( 1 , 10 , 20 ) print (x) y = 3 * x + 2 fig = plt.figure() axes = fig.add_axes([ 0.1 , 0.1 , 0.9 , 0.9 ]) axes.plot(x, y, 'r' ) plt.show() #%% 使用#%%會出現Run Cell字樣,按下Run Cell,可以執行Python Interactive視窗,

開發Python 使用 Visual Studio Code + Anaconda

圖片
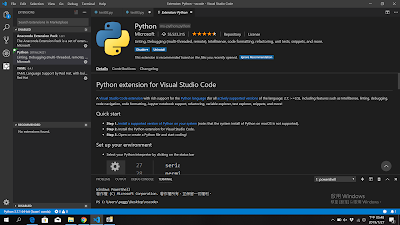
由於Pycharm需要付費,因此嘗試了 Visual Studio Code加上Anaconda 來開發python程式, 可以先下載 VS  Code ( https://code.visualstudio.com/ ) 然後下載 Anaconda ( https://www.anaconda.com/distribution/ ) 安裝完VS Code後,安裝Python extension for VS Code, 接著安裝Anaconda,然後在環境變數中設定 D : \Anaconda 3 D : \Anaconda 3 \Scripts D : \Anaconda 3 \Library \b in 如果python.exe的路徑有問題,可以在 檔案 -> 首選項 -> 設定 -> python.pythonPath 中去設定 建立第一個Python程式可以參考:  https://code.visualstudio.com/docs/python/python-tutorial 先建立一個資料夾,再新增一個helloworld.py到資料夾中, 在helloworld.py寫上 print ( "hello" ) 後按右鍵出現下拉視窗,選擇" Run Python File in Terminal" PS C:\Users\xxxxx\Desktop\vscode> & C:/Users/xxxxx/Anaconda3/python.exe c:/Users/xxxxx/Desktop/vscode/helloworld.pyesktop/vscode/helloworld.py hello

使用Pycharm開發Python程式與用Matplotlib繪圖

圖片
本篇介紹使用Pycharm開發Python程式與用Matplotlib套件繪圖。 1.  建立新專案並新增python檔案matplot.py 2. 在Pycharm中安裝matplotlib套件, 打開File-->Setting,找到Project Interpreter,點“+”添加   搜尋matplotlib後,安裝該套件。 3. 加入程式碼: from matplotlib import pyplot as plt import numpy as np x = np.linspace( 1 , 10 , 20 ) print (x) y = 3 * x + 2 fig = plt.figure() axes = fig.add_axes([ 0.1 , 0.1 , 0.9 , 0.9 ]) axes.plot(x , y , 'r' ) plt.show() 其中 (1) linspace的用法為:         numpy.linspace(start, stop, num=50, endpoint=True, retstep=False, dtype=None)               np.linspace(1,10,20)        #表示在1與10之間分20個點。  (2)  add_axes: 新增子區域      fig.add_axes(0.1,0.1,0.9,0.9)      #figure的百分比,從figure 10%的位置開始繪製, 寬高是figure的90% 5. 讓matplotlib繪圖變成浮在開發環境上,意思是讓figure浮窗 選擇File--->Settings--->Tools--->Python Scientific" 取消勾選Show plots in tool window