使用Pycharm開發Python程式與用Matplotlib繪圖
本篇介紹使用Pycharm開發Python程式與用Matplotlib套件繪圖。
1. 建立新專案並新增python檔案matplot.py
2. 在Pycharm中安裝matplotlib套件,打開File-->Setting,找到Project Interpreter,點“+”添加

搜尋matplotlib後,安裝該套件。

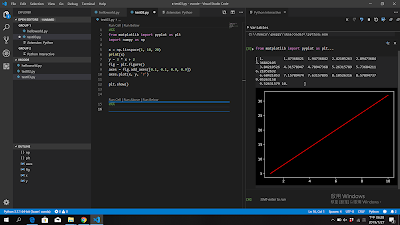
3. 加入程式碼:

其中
(1) linspace的用法為:
numpy.linspace(start, stop, num=50, endpoint=True, retstep=False, dtype=None)
np.linspace(1,10,20)
#表示在1與10之間分20個點。
選擇File--->Settings--->Tools--->Python Scientific"
取消勾選Show plots in tool window

1. 建立新專案並新增python檔案matplot.py
2. 在Pycharm中安裝matplotlib套件,打開File-->Setting,找到Project Interpreter,點“+”添加

搜尋matplotlib後,安裝該套件。

3. 加入程式碼:
from matplotlib import pyplot as plt
import numpy as np

x = np.linspace(1, 10, 20)
print(x)
y = 3 * x + 2fig = plt.figure()
axes = fig.add_axes([0.1, 0.1, 0.9, 0.9])
axes.plot(x, y, 'r')

plt.show()

其中
(1) linspace的用法為:
numpy.linspace(start, stop, num=50, endpoint=True, retstep=False, dtype=None)
np.linspace(1,10,20)
#表示在1與10之間分20個點。
(2) add_axes: 新增子區域 fig.add_axes(0.1,0.1,0.9,0.9) #figure的百分比,從figure 10%的位置開始繪製, 寬高是figure的90%
5. 讓matplotlib繪圖變成浮在開發環境上,意思是讓figure浮窗選擇File--->Settings--->Tools--->Python Scientific"
取消勾選Show plots in tool window


留言