發表文章

目前顯示的是 2019的文章

[LabVIEW] Four Hex array to Float by using Type Cast 使用Type Cast將四個16進位整數轉換成浮點數

圖片
This example shows how to transfer four hex integer array into float by using type cast. 本範例說明如何使用Type cast將四個16進位整數轉換成浮點數。 We will share more tutorial videos with people who want to learn LabVIEW. welcome to subscribe this channel. 未來會陸續更新影片,讓想學習LabVIEW的朋友可以看影片學習,歡迎訂閱此頻道。 其他網址/related websites: https://labview-tech.blogspot.com/ https://fishark.pixnet.net/blog email: jacklee3633 @gmail.com Line: lvnet

[LabVIEW] Hex array to string by using Type Cast使用Type Cast將16進位整數轉換成字串

圖片
This example shows how to use Type Cast to transfer Hex integer array to string 本範例說明如何使用Type Cast將16進位整數轉換成字串 We will share more tutorial videos with people who want to learn LabVIEW. welcome to subscribe this channel. 未來會陸續更新影片,讓想學習LabVIEW的朋友可以看影片學習,歡迎訂閱此頻道。 其他網址/related websites: https://labview-tech.blogspot.com/ https://fishark.pixnet.net/blog email: jacklee3633 @gmail.com Line: lvnet

[LabVIEW][Voice]Use Timezoneinfo class to get different timezone information使用Timezoneinfo類別去獲取不同的時區資訊

圖片
This movie shows how to call Timezoneinfo and ReadOnlyCollection class from .net framework (LabVIEW 2012 supports .net framework 3.5). Window's timezone has been set as Japan time (timezone +9). We can use methods and properties of Timezoneinfo class to covert the standard time from Japan to Taipei. 本影片呈現如何使用LabVIEW呼叫 .net framework中的 Timezoneinfo 和 ReadOnlyCollection類別 (LabVIEW 2012 支援 .net framework 3.5)。 微軟的系統時區已經先被設成日本時間(時區+9),我們使用 Timezoneinfo類別中的方法與屬性來將日本的時間轉換成台北時間。 備註/Note: Timezoneinfo class: https://docs.microsoft.com/zh-tw/dotnet/api/system.timezoneinfo?view=netframework-4.8 ReadOnlyCollection class: https://docs.microsoft.com/zh-tw/dotnet/api/system.collections.objectmodel.readonlycollection-1?view=netframework-4.8 We will share more tutorial videos with people who want to learn LabVIEW. welcome to subscribe this channel. 未來會陸續更新影片,讓想學習LabVIEW的朋友可以看影片學習,歡迎訂閱此頻道。 其他網址/related websites: https://labview-tech.blogspot.com/ https://fishark.pixnet.net

[LabVIEW] [Voice] Get items in Timestamp 獲取Timestamp的細項資料

圖片
This movie shows how to get the integer of floating data format of year, month, date, hour, minute and second from timestamp. 本篇影片說明如何將Timestamp中的年、月、日、時、分、秒的資料用整數說是浮點數的資料型態取出。 We will share more tutorial videos with people who want to learn LabVIEW. welcome to subscribe this channel. 未來會陸續更新影片,讓想學習LabVIEW的朋友可以看影片學習,歡迎訂閱此頻道。 其他網址/related websites: https://labview-tech.blogspot.com/ https://fishark.pixnet.net/blog email: jacklee3633 @gmail.com Line ID: lvnet

[LabVIEW] How to read binary 2D array from file 如何從檔案中讀出二進位2D矩陣

圖片
This example shows how to read 2D array form a binary file. 這個範例展示如何從一個二進位檔案中讀取2D矩陣資料。 We will share more tutorial videos with people who want to learn LabVIEW. welcome to subscribe this channel. 未來會陸續更新影片,讓想學習LabVIEW的朋友可以看影片學習,歡迎訂閱此頻道。 其他網址/related websites: https://labview-tech.blogspot.com/ https://fishark.pixnet.net/blog email:  jacklee3633 @gmail.com Line ID: lvnet

[LabVIEW] How to write binary 2D array to file 如何將二進位2D矩陣寫入檔案

圖片
This example shows how to write 2D array into a binary file. 這個範例展示如何將2D矩陣資料寫入一個二進位檔案中。   We will share more tutorial videos with people who want to learn LabVIEW. welcome to subscribe this channel. 未來會陸續更新影片,讓想學習LabVIEW的朋友可以看影片學習,歡迎訂閱此頻道。 其他網址/related websites: https://labview-tech.blogspot.com/ https://fishark.pixnet.net/blog email:  jacklee3633 @gmail.com Line ID: lvnet

[LabVIEW]Use mouse and event structure to draw rectangle on waveform graph 使用滑鼠與事件結構在圖形控制向上繪製長方形

圖片
This is the example which shows how to use events of the mouse (down, move and up) to draw rectangle on the waveform graph. You can learn how to use event structure, waveform graph property, picture function and bundle/ unboundle vi to implement this example. 這個範例說明如何使用滑鼠的事件,像是按下、移動與釋放去繪製長方形在在圖形控制向上。你可以學習如何使用事件結構、圖形控制的屬性、圖形功能以及bondle/unboundle vi來完成這個範例。 We will share more tutorial videos with people who want to learn LabVIEW. welcome to subscribe this channel. 未來會陸續更新影片,讓想學習LabVIEW的朋友可以看影片學習,歡迎訂閱此頻道。 其他網址/related websites: https://labview-tech.blogspot.com/ https://fishark.pixnet.net/blog

[Arduino] Mega 2560 Analog Inputs are transferred to voltage/將mega 2560的類比輸入轉成電壓訊號

圖片
Read A0, A1 and A15 analog input and transfer to voltage value. in Range function check if voltage is in the right range. 讀出A0, A1和A15的類比訊號,轉換成電壓訊號, 然後再用inRange函式判斷是否有在正確的範圍內。 未來會陸續更新影片,讓想學習LabVIEW的朋友可以看影片學習,歡迎訂閱此頻道。 其他網址:  https://labview-tech.blogspot.com/  https://fishark.pixnet.net/blog

[LabVIEW] Report generation: print to PDF 產生報告,列印成PDF

圖片
print the report including data and graph to PDF format 將資料和圖表輸出成報告,列印成PDF格式。 未來會陸續更新影片,讓想學習LabVIEW的朋友可以看影片學習,歡迎訂閱此頻道。 其他網址:  https://labview-tech.blogspot.com/  https://fishark.pixnet.net/blog

[LabVIEW] Generate Report: print to HTML 用HTML的格式產生報告

圖片
Output data and graph content to HTML report 將資料與圖表內容輸出產生HTML報告 使用LabVIEW中的Report Generation VI來將資料與圖表輸出成HTML報告 未來會陸續更新影片,讓想學習LabVIEW的朋友可以看影片學習,歡迎訂閱此頻道。 其他網址: https://labview-tech.blogspot.com/ https://fishark.pixnet.net/blog

[LabVIEW] Customized Menu & Event Structure & Queue 使用Run-Time Menu與事件結構做互動

圖片
Use Customized Menu, Event Structure and Queue to operate signals in different while loop for Producer Consumer Design Pattern. 以下影片是說明如何操作Run-Time Menu來做一格客製化的Menu bar,並在Event Structure中使用Menu操作時的訊號傳遞給Queue,使用Queue來在Event Structure與另一個While Loop做溝通做字串顯示的互動。 未來會陸續更新影片,讓想學習LabVIEW的朋友可以看影片學習,歡迎訂閱此頻道。  其他網址: https://labview-tech.blogspot.com/ https://fishark.pixnet.net/blog

[LabVIEW] Multi Graph with Timestamp for showing current time 用timestamp呈現多筆資料的圖表顯示

圖片
Multi Graph with Timestamp for showing current time 用timestamp呈現多筆資料的圖表顯示 1. X軸使用目前時間的時分秒的方式表示 2. 將多筆資料在一個XY waveform顯示 未來會陸續更新影片,讓想學習LabVIEW的朋友可以看影片學習,歡迎訂閱此頻道。

[LabVIEW] Customized Menu and Event Structure /客製化Menu與事件結構

圖片
Use Run-Time menu to interact with Event Structure 使用Run-Time Menu與事件結構做互動 以下影片是說明如何操作Run-Time Menu來做一格客製化的Menu bar,並在Event Structure中使用Menu操作時的訊號來做字串顯示的互動。   未來會陸續更新影片,讓想學習LabVIEW的朋友可以看影片學習,歡迎訂閱此頻道。

LabVIEW教學: 如何在VI中使用.dll檔

圖片
由於許多的軟體都提供SDK給開發者使用,因此可以在VI中呼叫dll檔使用,一般有兩種方法: 1.  Import  Shared Library 2.    Call Library Function Node 以下是相關的教學連結: 1.  我要如何使用 LabVIEW 來呼叫動態連接函式庫 (Dynamic Link Library DLL)? 2.  Using Shared Libraries in LabVIEW

[3C] 榮耀手環5 血氧、睡眠與運動功能體驗 Honor band 5: Sleep, SpO2, and Workout experience

圖片
由於榮耀手環 5推出了血氧功能,這是在1000元左右的智慧手環中有血氧功能的,於是我便取得了一支來體驗。 Honor Band 5 launched its first SpO2 detection function with the price lower than 33 USD. I got one to experience some new functions. 榮耀手環5是可以換錶盤的,不過我使用的運動健康App找不到這功能,就僅能用手環內建的錶盤進行選擇。 One of new functions is to change face of  Honor Band 5. But I can not find any face change function in my Health App. I just select faces built in Honor Band 5. 榮耀手環5貼靠手脘的部分是曲面的,光學元件的部分較不突出,戴起來感覺比較舒適些。  Honor Band is comfortable to wear because its curve shape design.   接下來介紹幾個我常用的功能: I introduce some functions I usually use.   1. 睡眠偵測: 可以提供深睡、淺睡與REM的分布,會提供分析,告訴使用者哪一個階段的會棉是否正常,以及提供建議。 1. Sleep detection: This function can provide  distribution of Deep Sleep, Light Sleep, REM and Awake and analyze sleep data to provide recommendation for improving sleep quality. 2. 在鍛鍊部分,我喜歡用自由訓練的功能,可以在運動前啟動,然後記錄每秒的心律,不需依賴手機的連結,我覺得很方便。 2. Workout: I like to use Free Training function. You should start this function before exercise. Ho

在VS code中安裝Python套件virtualenv

圖片
在Python的開發中,通常會使用 VirtualEnv,將系統的Python環境複製一份到VirtualEnv建立的資料夾,以便管理執行環境,以及開發不同應用程式的套件管理。 安裝VirtualEnv 的指令如下: pip install virtualenv 在D槽建一個pydemo資料夾,並切換到該資料夾目錄 cd D:\pydemo 或是 cd D:\ mkdir pydemo cd pydemo 下指 令建立 虛擬環境的工程目錄   virtualenv --no-site-packages .venv PS D:\pydemo> virtualenv --no-site-packages .venv Using base prefix 'c:\\users\\xxxxx\\anaconda3'   No LICENSE.txt / LICENSE found in source New python executable in D:\pydemo\.venv\Scripts\python.exe Installing setuptools, pip, wheel... done. 將目前power shell的環境切換到虛擬環境之中 PS D:\pydemo> . ./.venv/Scripts/activate.ps1 (.venv) PS D:\pydemo> .venv資料夾的內容 參考文件: 1.  在 Visual Studio Code 中配置 Python Flask 环境   ( https://segmentfault.com/a/1190000012149680 ) 2.  Python with VirtualEnv ( https://dotblogs.com.tw/mystic_pieces/2018/11/01/232938 ) 3.  Git 教學:終端機及常用指令介紹 ( https://gitbook.tw/chapters/command-line/command-line.html )

在VS code IDE中查詢Python安裝的套件

圖片
在VS code IDE中查詢Python安裝的套件,在Terminal中輸入 pip list 即會出現已安裝的套件清單

使用VS code開發Python程式 - Matplotlib繪圖

圖片
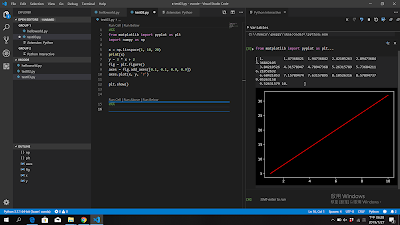
這一篇為如何在VS code的IDE 中用python開發matplotlib, 程式碼如下: #%% from matplotlib import pyplot as plt import numpy as np x = np.linspace( 1 , 10 , 20 ) print (x) y = 3 * x + 2 fig = plt.figure() axes = fig.add_axes([ 0.1 , 0.1 , 0.9 , 0.9 ]) axes.plot(x, y, 'r' ) plt.show() #%% 使用#%%會出現Run Cell字樣,按下Run Cell,可以執行Python Interactive視窗,

開發Python 使用 Visual Studio Code + Anaconda

圖片
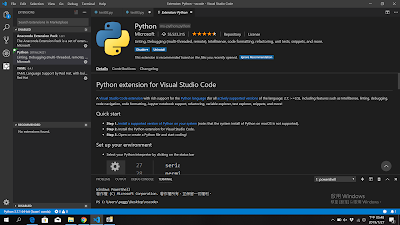
由於Pycharm需要付費,因此嘗試了 Visual Studio Code加上Anaconda 來開發python程式, 可以先下載 VS  Code ( https://code.visualstudio.com/ ) 然後下載 Anaconda ( https://www.anaconda.com/distribution/ ) 安裝完VS Code後,安裝Python extension for VS Code, 接著安裝Anaconda,然後在環境變數中設定 D : \Anaconda 3 D : \Anaconda 3 \Scripts D : \Anaconda 3 \Library \b in 如果python.exe的路徑有問題,可以在 檔案 -> 首選項 -> 設定 -> python.pythonPath 中去設定 建立第一個Python程式可以參考:  https://code.visualstudio.com/docs/python/python-tutorial 先建立一個資料夾,再新增一個helloworld.py到資料夾中, 在helloworld.py寫上 print ( "hello" ) 後按右鍵出現下拉視窗,選擇" Run Python File in Terminal" PS C:\Users\xxxxx\Desktop\vscode> & C:/Users/xxxxx/Anaconda3/python.exe c:/Users/xxxxx/Desktop/vscode/helloworld.pyesktop/vscode/helloworld.py hello

使用Pycharm開發Python程式與用Matplotlib繪圖

圖片
本篇介紹使用Pycharm開發Python程式與用Matplotlib套件繪圖。 1.  建立新專案並新增python檔案matplot.py 2. 在Pycharm中安裝matplotlib套件, 打開File-->Setting,找到Project Interpreter,點“+”添加   搜尋matplotlib後,安裝該套件。 3. 加入程式碼: from matplotlib import pyplot as plt import numpy as np x = np.linspace( 1 , 10 , 20 ) print (x) y = 3 * x + 2 fig = plt.figure() axes = fig.add_axes([ 0.1 , 0.1 , 0.9 , 0.9 ]) axes.plot(x , y , 'r' ) plt.show() 其中 (1) linspace的用法為:         numpy.linspace(start, stop, num=50, endpoint=True, retstep=False, dtype=None)               np.linspace(1,10,20)        #表示在1與10之間分20個點。  (2)  add_axes: 新增子區域      fig.add_axes(0.1,0.1,0.9,0.9)      #figure的百分比,從figure 10%的位置開始繪製, 寬高是figure的90% 5. 讓matplotlib繪圖變成浮在開發環境上,意思是讓figure浮窗 選擇File--->Settings--->Tools--->Python Scientific" 取消勾選Show plots in tool window

使用Pycharm開發第一支Python程式-Hello World

圖片
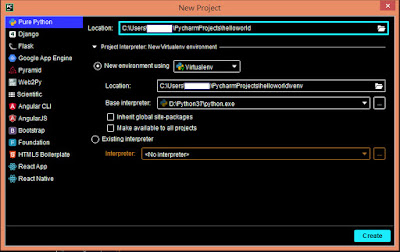
本篇簡單說明如何使用Pycharm來開發Python程式, 以下是建立.py與執行 的步驟: 1. File-->New project 2. 在helloworld資料夾右鍵,出現下拉選單,選擇-->New-->Python File 3. 填上檔案名稱 4. 在程式碼中填入 print ( "Hello World!" ) 5. 在helloworld.py上按右鍵,出現下拉選單,選擇Run 'helloworld' 6. 下方視窗即出現執行結果。

使用PyCharm建立Django與MySQL連結 (未完)

圖片
首先,這篇是想要敘述如何使用PyCharm將MySQL中的資料庫與Django中的Model, View與Template框架做連結,專案的程式內容是從網路的分享文件而來,並非自己撰寫,取得source code可以從這個網址 ()。 如何將MySQL資料庫呈現在django製作的網頁上需要遵循MVT框架原則,事實上在Django中需要對views.py, model.py與template中的html檔分別撰寫程式,其整理的關係如下圖: 在PyCharm實現這個專案的步驟如下: 1. 

Django的MTV框架互動流程

圖片
本篇來整理一下Django的MTV框架,了解彼此間的關係與應用, MTV代表了Model, Template與View, 由 Model 負責資料層,View 負責視覺,Controller 負責商業邏輯的部份。 用下圖來說明MTV之間的互動流程,當使用者用瀏覽器與Django寫的網頁進行互動,首先會是跟哪個URL先產生互動,url.py會有urlpatterns來定義互動的網頁/址與對應的函數,如與company/互動,就會對應到view中company函數。 view.py中有def company(request)函數,使用者提出了一個request (HttpRequest),view會負責處理request,並提供response (HttpResponse),例如在資料庫中取得stockid的資料,並response給company.html。 view.py所需要取得的資料是由model.py來處理,model.py有class  Company(models Model) 裡面連結資料庫中的欄位,如Stock_ID,連結了stockid變數,開發者可以使用 stockid,而無須寫MySQL語言與資料庫溝通。 Template則是存放.html的資料夾,使用者在company/提出request,經由url.py引導到view.py負責處理的函數,然後response到company.html,例如在company中顯示stockid的資料。

啟動MySQL Workbench與建立Database 和 Table

圖片
再安裝好MySQL後, 我們先啟動Workbench,來建立Database 和 Table。 啟動Workbench,輸入root密碼, 建立Test 連線 建立一個新的schema 建立資料庫 建立一個新的table 設定好student_id, student_name, student_age Select rows - Limit 1000