[Note 1] Generate BIN and HEX file in STM32CubeIDE/在STM32CubeIDE產生 BIN及HEX燒錄檔 取得連結 Facebook X Pinterest 以電子郵件傳送 其他應用程式 - 10月 24, 2021 This video shows how to generate BIN and HEX file in STM32CubeIDE 這個視頻說明如何在STM32CubeIDE產生 BIN及HEX燒錄檔 取得連結 Facebook X Pinterest 以電子郵件傳送 其他應用程式 留言
在 VS Code 安裝Opencode - 2月 16, 2026 在 VS Code 安裝插件 1. 搜尋插件 :打開 VS Code,點擊左側的 Extensions(擴充功能) 圖示,搜尋 「open Code」 。 2. 點擊安裝 :找到該插件後點擊「Install(安裝)」 。 第三階段:啟動與使用 1. 啟動插件 :安裝完成後,按下快捷鍵 Ctrl + Shift + P 打開命令面板,輸入命令 Open openCode 並回車,即可在 VS Code 中以插件形式開啟 OpenCode 。 如果出現的紅字錯誤是因為 Windows PowerShell 的安全機制(執行原則)預設攔截了腳本執行。這就像您買了工具箱,但蓋子被鎖住了。 請按照以下步驟「開鎖」,即可正常使用: 第一步:解除 PowerShell 執行限制 請按下 Win 鍵,輸入 PowerShell 。 對著「Windows PowerShell」按右鍵,選擇 「以系統管理員身分執行」 。 在視窗中輸入以下指令並按 Enter : PowerShell Set-ExecutionPolicy RemoteSigned -Scope CurrentUser 當系統詢問是否變更時,請輸入 Y 然後按 Enter 。 第二步:再次執行 OpenCode 現在回到您原本的資料夾(或剛才那個視窗),再次嘗試執行指令: PowerShell opencode - -port 45824 這時候應該就不會再跳出「因為這個系統上已停用指令碼執行」的錯誤了。 Read more »
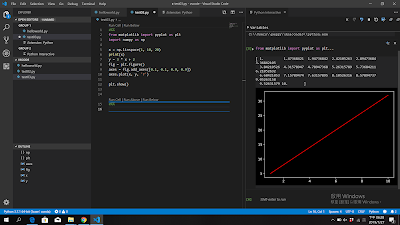
使用VS code開發Python程式 - Matplotlib繪圖 - 7月 27, 2019 這一篇為如何在VS code的IDE 中用python開發matplotlib, 程式碼如下: #%% from matplotlib import pyplot as plt import numpy as np x = np.linspace( 1 , 10 , 20 ) print (x) y = 3 * x + 2 fig = plt.figure() axes = fig.add_axes([ 0.1 , 0.1 , 0.9 , 0.9 ]) axes.plot(x, y, 'r' ) plt.show() #%% 使用#%%會出現Run Cell字樣,按下Run Cell,可以執行Python Interactive視窗, Read more »
使用Pycharm開發Python程式與用Matplotlib繪圖 - 7月 07, 2019 本篇介紹使用Pycharm開發Python程式與用Matplotlib套件繪圖。 1. 建立新專案並新增python檔案matplot.py 2. 在Pycharm中安裝matplotlib套件, 打開File-->Setting,找到Project Interpreter,點“+”添加 搜尋matplotlib後,安裝該套件。 3. 加入程式碼: from matplotlib import pyplot as plt import numpy as np x = np.linspace( 1 , 10 , 20 ) print (x) y = 3 * x + 2 fig = plt.figure() axes = fig.add_axes([ 0.1 , 0.1 , 0.9 , 0.9 ]) axes.plot(x , y , 'r' ) plt.show() 其中 (1) linspace的用法為: numpy.linspace(start, stop, num=50, endpoint=True, retstep=False, dtype=None) np.linspace(1,10,20) #表示在1與10之間分20個點。 (2) add_axes: 新增子區域 fig.add_axes(0.1,0.1,0.9,0.9) #figure的百分比,從figure 10%的位置開始繪製, 寬高是figure的90% 5. 讓matplotlib繪圖變成浮在開發環境上,意思是讓figure浮窗 選擇File--->Settings--->Tools--->Python Scientific" 取消勾選Show plots in tool window Read more »


留言