[第21期]Use PyQtGraph and PyQt to implement line and scatter plots/使用PyQtGraph與PyQt實現線與散狀圖
This video shows how to use PyQtGraph and PyQt to implement line and scatter plots.
The content includes:
1. PyQtGraph Introduction
2. Embedding custom widgets from Qt Designer
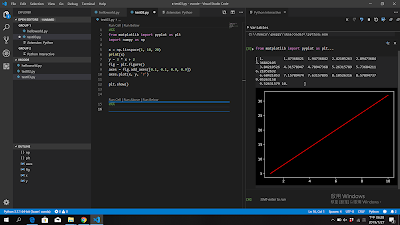
3. Use PlotWidget.plot() to add data to plot widget
本視頻說明如何使用PyQtGraph與PyQt實現線與散狀圖。
內容包含:
1. PyQtGraph簡介
2. 在Qt Designer嵌入客製化部件模組
3. 使用PlotWidget.plot()新增資料到繪圖部件中


留言